
Monthly Performance Report
A business-owner snapshot of how Coral's website performed in August: stronger traffic, better engagement, page-growth across key service areas, improving lead-intent tracking, and the honest next steps needed to turn more online interest into calls, forms, quote requests, and booked work.
Headline takeaway for Steve
August was Coral's strongest month so far in this reporting series. The website reached 373 active users, 363 new users, and 575 sessions. Compared with July, active users increased by 19.9%, new users increased by 19.4%, and sessions increased by 29.5%.
The biggest improvement was engagement quality. Page views doubled from 641 to 1,288, event count rose from 1,839 to 3,451, and average engagement time per active user improved from 40 seconds to 1m 57s. That is a major recovery from July's engagement concern.
The truthful caution is conversion. Key events stayed at 2. Traffic and engagement improved strongly, but the recorded high-value actions did not grow with them. That means the website is attracting and engaging more people, but Coral still needs stronger conversion pathways and more complete key-event tracking.
Coral's visibility and engagement both moved forward in August. More people arrived, more visits started, more pages were viewed, and more form/rebate/financing actions were recorded.
The month looks strong, but key events did not increase. The next stage is not just more traffic; it is better conversion design and cleaner lead measurement.
Owner summary
Users up • Sessions up • Page views doubled • Events up • Form starts and form submissions improvedKey events stayed at 2 • Session key event rate softened • Referral traffic needs quality review • Some new pages show high engagement from very small user countsAugust was a genuine growth month, especially for traffic and engagement. The only reason not to over-celebrate is that recorded conversion actions did not scale at the same pace.
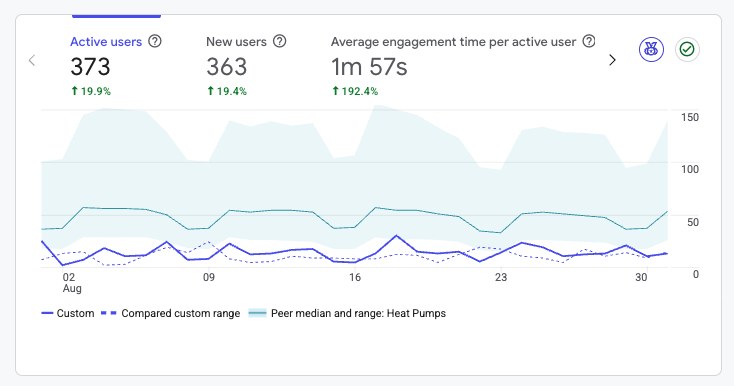
This table compares August against July and separates the strong reach/engagement story from the flatter conversion story.
| Metric | August 2026 | July 2026 | Change | Business meaning |
|---|---|---|---|---|
| Active users | 373 | 311 | Up 19.9% | More people actively visited Coral's website. |
| New users | 363 | 304 | Up 19.4% | New audience discovery improved again. |
| Sessions | 575 | 444 | Up 29.5% | Visit volume increased materially. |
| Engaged sessions | 292 | 199 | Up 46.7% | More visits showed meaningful engagement. |
| Engagement rate | 50.78% | 44.82% | Up 13.3% | A larger share of visits were useful sessions. |
| Page views | 1,288 | 641 | Up 100.9% | Visitors viewed many more pages overall. |
| Views per active user | 3.45 | 2.06 | Up 67.5% | Page depth improved after July's flat result. |
| Average engagement time per active user | 1m 57s | 40s | Up 192.4% | Visitors spent much more active time on the site. |
| Event count | 3,451 | 1,839 | Up 87.7% | Total tracked activity rose sharply. |
| Events per session | 6.00 | 4.14 | Up 44.9% | Sessions became more action-rich. |
| Key events | 2 | 2 | No change | High-value tracked outcomes did not increase. |
| Session key event rate | 0.35% | 0.45% | Down 22.8% | Conversions did not keep pace with traffic growth. |
August created a much bigger and more engaged audience. The website is doing more work, but the lead path still needs tightening because key events stayed flat while sessions rose.
1. Growth is real
Traffic was not just up slightly. Sessions increased by 29.5%, active users increased by 19.9%, and new users increased by 19.4%. That is a meaningful month of added reach.
2. Engagement recovered
July's concern was that visitors arrived but did not explore deeply. August reversed that pattern: page views doubled, engagement time improved, and events per session rose.
3. Conversion is the gap
Key events stayed at 2. The site attracted more people and kept them more engaged, but recorded lead outcomes did not yet increase. That is the next improvement area.
Sessions by channel
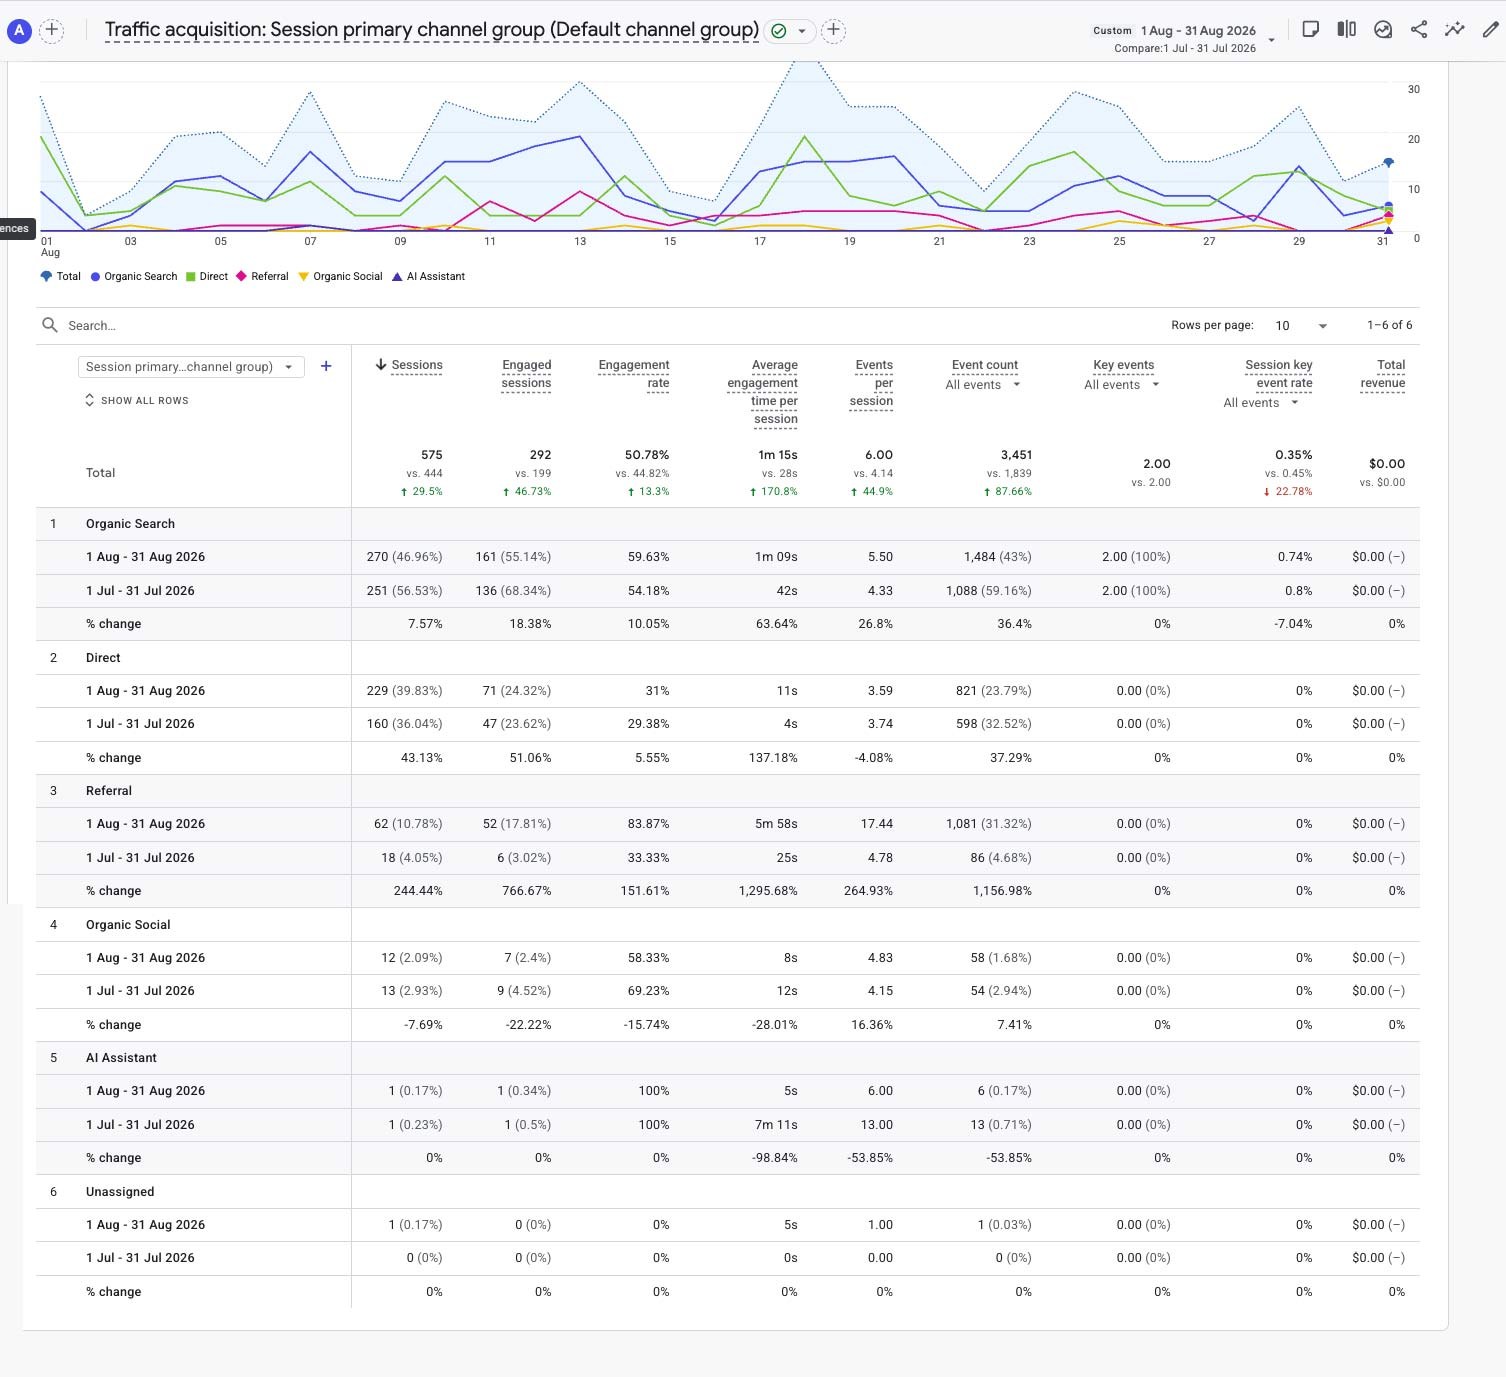
Organic Search remained the largest session source, while Direct and Referral traffic rose sharply.
Channel interpretation
Organic delivered 270 sessions, 161 engaged sessions, and both recorded key events. This continues to be Coral's strongest channel.
Direct sessions rose from 160 to 229. This may include brand-aware visitors, repeat visitors, bookmarks, GBP/app activity, or untagged links.
Referral sessions rose from 18 to 62 and generated unusually high engagement. That could be useful partner traffic, but it should be reviewed to confirm it is legitimate and not inflated by tools, bots, or internal activity.
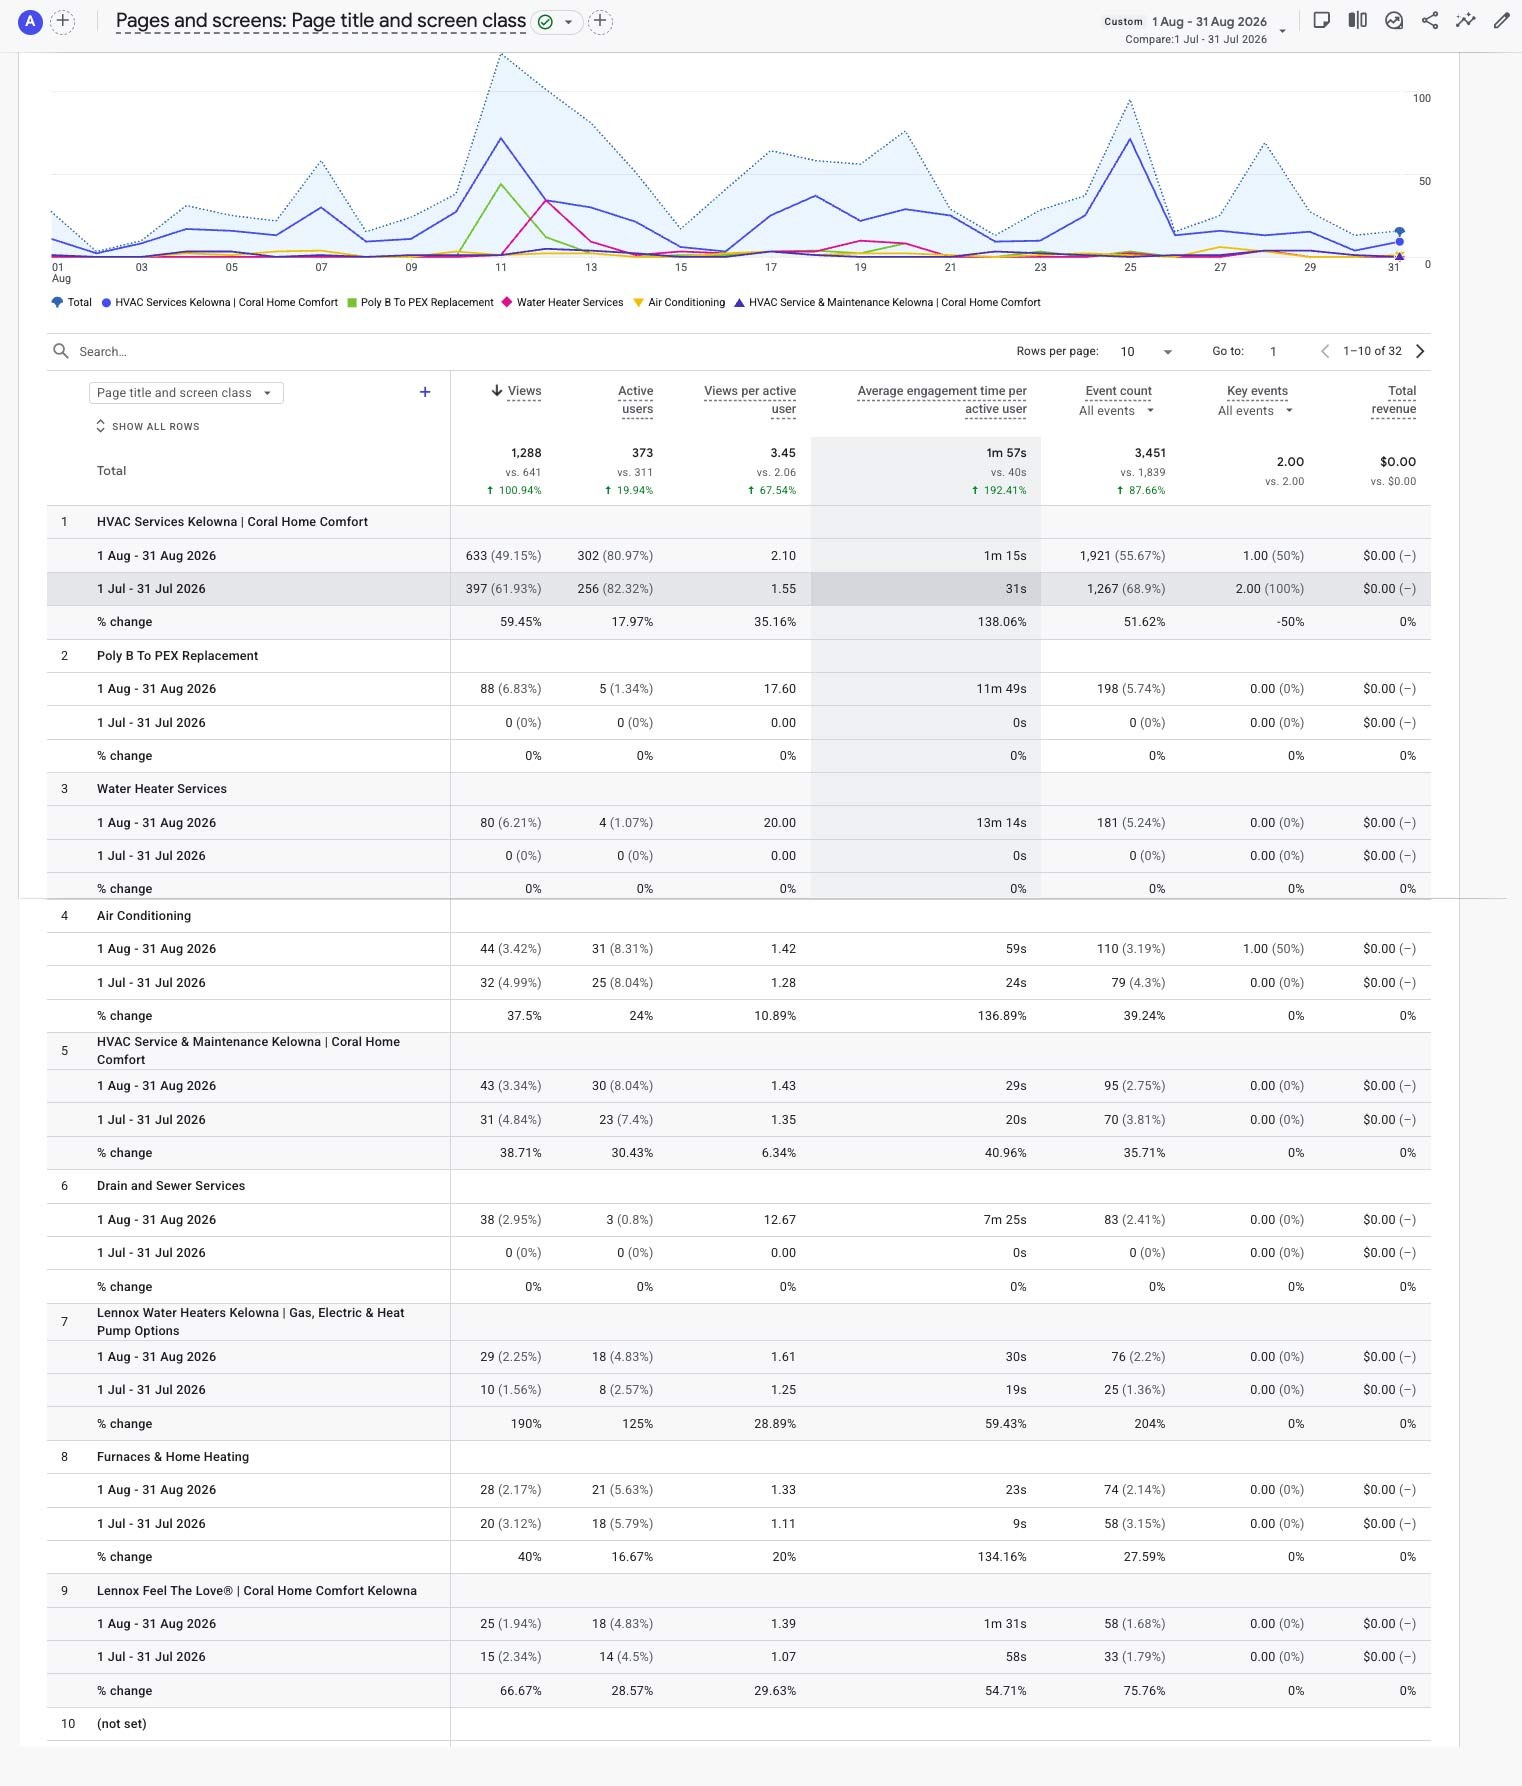
August shows a much stronger page story. The HVAC Services page remained the main gateway, while new service-expansion pages created additional visibility.
| Page title / screen | August views | July views | Change | Business note |
|---|---|---|---|---|
| HVAC Services Kelowna | Coral Home Comfort | 633 | 397 | Up 59.4% | The clear front door. It carried almost half of all page views and produced 1 of the 2 key events shown in the page report. |
| Poly B To PEX Replacement | 88 | - | New page signal | Strong new service-page activity, though active-user count was small. Treat as promising, not proven demand yet. |
| Water Heater Services | 80 | - | New page signal | Strong content expansion signal, again with a small user base. Keep building this pathway carefully. |
| Air Conditioning | 44 | 32 | Up 37.5% | Cooling-season interest remained healthy and produced 1 recorded key event. |
| HVAC Service & Maintenance Kelowna | Coral Home Comfort | 43 | 31 | Up 38.7% | Maintenance content improved and should connect clearly to Comfort Club and service booking. |
| Drain and Sewer Services | 38 | - | New page signal | A new plumbing-related service area is beginning to show in the data. |
| Lennox Water Heaters Kelowna | Gas, Electric & Heat Pump Options | 29 | 10 | Up 190.0% | Recovered strongly after July. Internal links and CTAs should stay in place. |
| Furnaces & Home Heating | 28 | 20 | Up 40.0% | Heating interest is starting to matter again as fall approaches. |
| Lennox Feel The Love® | Coral Home Comfort Kelowna | 25 | 15 | Up 66.7% | Useful trust/community content that supports brand warmth and credibility. |
| HVAC Maintenance Kelowna | Coral Comfort Club | 10 | 36 | Down 72.2% | This page softened and should be re-linked from maintenance, service, and homepage sections. |
The HVAC Services page is doing serious work. It needs to be treated as Coral's main conversion gateway and route visitors into service-specific next steps.
Poly B, Water Heater Services, and Drain/Sewer pages look promising, but some of the engagement is based on very small active-user counts. They are excellent early indicators, not final proof of market demand.
Tracked event activity
| Event | August count | July count | Change | What it means |
|---|---|---|---|---|
| page_view | 1,288 | 641 | Up 100.9% | Page viewing doubled. |
| user_engagement | 1,001 | 326 | Up 207.1% | Engagement pings recovered strongly. |
| session_start | 577 | 446 | Up 29.4% | More visits started. |
| first_visit | 363 | 304 | Up 19.4% | New visitor discovery improved. |
| scroll | 112 | 75 | Up 49.3% | More visitors reached deeper page sections. |
| form_start | 49 | 15 | Up 226.7% | Form intent increased sharply. |
| form_submit | 19 | 4 | Up 375.0% | Potential lead submissions improved. Confirm these represent successful submissions. |
| rebate_click | 18 | 9 | Up 100.0% | Rebate/Fortis interest doubled. |
| financing_click | 7 | 5 | Up 40.0% | Financing interest improved modestly. |
| click | 6 | 6 | No change | Generic click volume was flat. |
| Key events | 2 | 2 | No change | High-value outcomes stayed flat despite traffic growth. |
Is Tag Manager working?
Yes. August confirms the GTM/GA4 lead-intent setup is collecting far more meaningful behaviour than June did. The strongest evidence is the growth in form_start, form_submit, rebate_click, and financing_click events.
Form starts rose from 15 to 49, form submissions rose from 4 to 19, rebate clicks doubled, and financing clicks improved. The event-tracking layer is now producing useful monthly reporting data.
Key events stayed at 2. If form_submit is a true successful submission, it should either be marked as a key event or converted into a cleaner generate_lead event after successful form completion.
form_start: 49
form_submit: 19
rebate_click: 18
financing_click: 7
key events: 2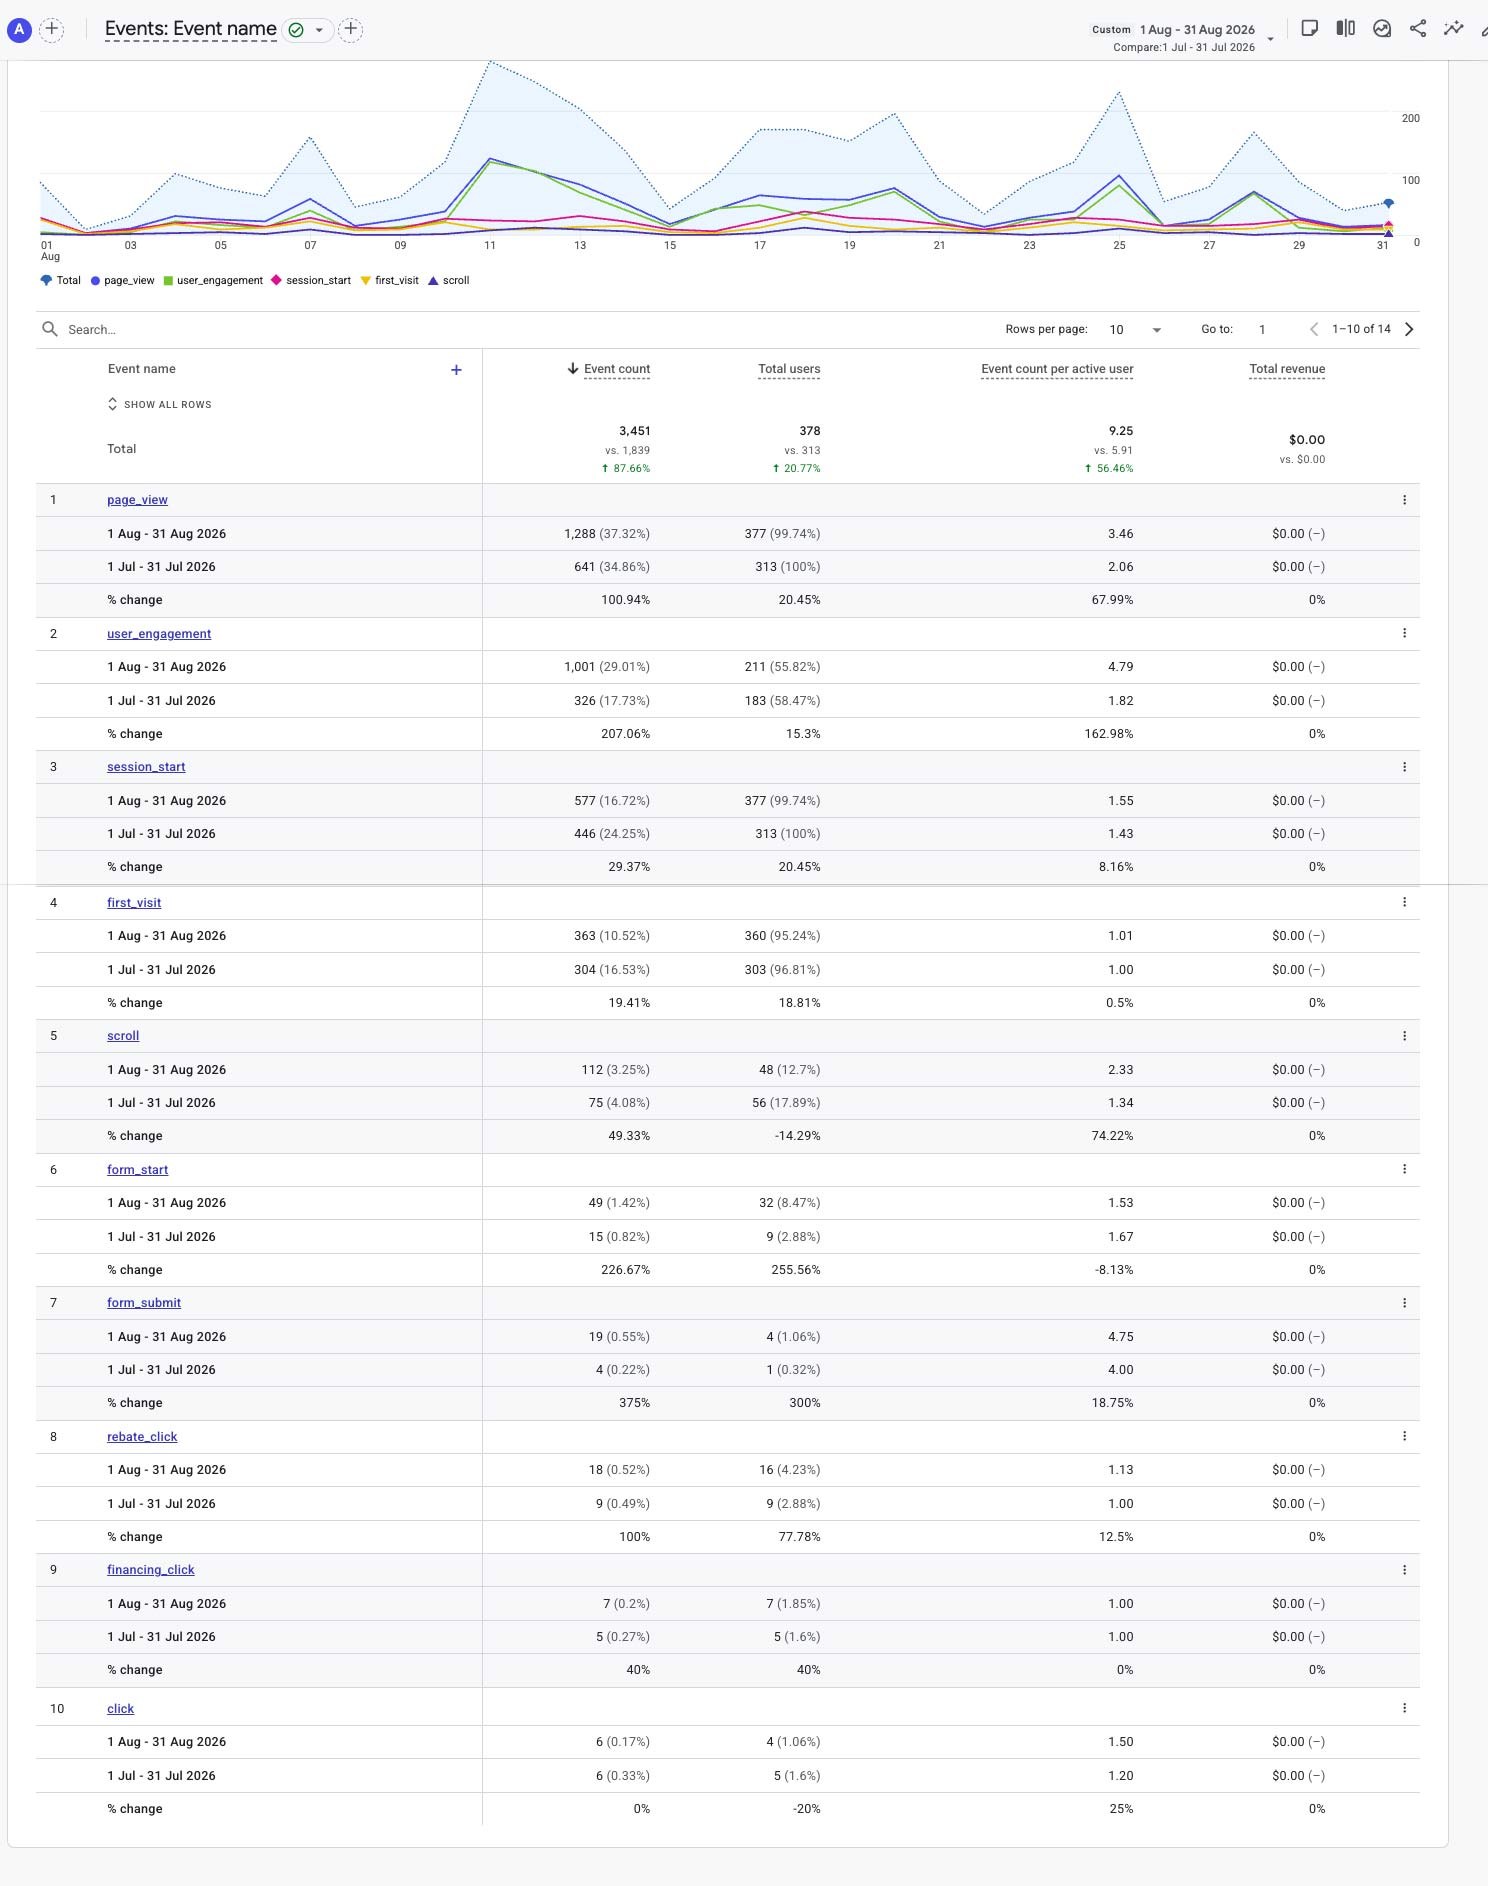
What is going right
- Traffic is growing: sessions increased from 444 to 575.
- Engagement recovered: average engagement time per active user rose from 40s to 1m 57s.
- Page depth improved: page views doubled and views per active user rose strongly.
- Organic Search remains strong: it produced 270 sessions and both recorded key events.
- Lead-intent tracking is maturing: form, rebate, and financing activity is now visible.
- Service expansion is showing up: Poly B, Water Heater Services, Drain/Sewer, and Lennox pages now have measurable activity.
What still needs work
- Key events are flat: 2 key events in August compared with 2 in July.
- Conversion rate softened: session key event rate fell from 0.45% to 0.35% because sessions grew faster than key outcomes.
- Referral traffic needs checking: the August referral spike is unusually strong and should be reviewed.
- Form-submit quality needs confirmation: confirm whether form_submit equals an actual successful lead.
- Some new page wins are early: very high engagement from small user counts should be treated carefully.
Business interpretation
Coral is going in the right direction. August is a much stronger month than July for traffic, engagement, page depth, and measurable actions. The business opportunity is now clearer: Coral has earned more attention, but the website must turn more of that attention into phone calls, confirmed forms, quote requests, and emergency/service pathways.
The page generated 633 views. Add clear pathways to AC, heating, maintenance, Comfort Club, rebates, financing, plumbing, emergency response, and quote/request forms.
If form_submit represents a successful form submission, mark it as a key event or fire a separate generate_lead event only after successful completion.
Referral sessions and event count grew unusually fast. Identify the source and decide whether it is valuable partner traffic, internal review traffic, or reporting noise.
Poly B, Water Heater Services, Drain/Sewer, and Lennox pages should get stronger CTAs, internal links, and service-form routes, but decisions should be based on more months of data.
Confirm quote_request_click, emergency_call_click, kristen_demo_click, and technician_transfer_intent events so emergency and AI-assistant pathways can be reported properly.
Direct traffic is growing, but some of it may be untagged campaign or GBP traffic. UTM links will make the source story cleaner.
August was a strong month for Coral Home Comfort. Traffic grew, page views doubled, engagement time recovered, service-page activity expanded, and GTM/GA4 event tracking is now giving Coral a much clearer view of customer intent. The report is not all positive: key events stayed flat, the conversion rate softened, and referral traffic needs a quality review. Overall, though, Coral is building the right digital foundation. The next win will come from turning this larger audience into more confirmed leads and service opportunities.
Quick reference for Steve
These are the plain-English meanings of the main metrics used in this report.
Active users
Unique people who actively visited the site during the reporting window. This is a cleaner audience number than raw page views.
New users
People who visited Coral's website for the first time during the month, according to GA4.
Sessions
Total visits. One person can create more than one session if they come back later.
Engaged sessions
Visits where the user stayed long enough, viewed enough, or performed enough action for GA4 to treat the session as meaningfully engaged.
Engagement rate
The percentage of sessions that were engaged. Higher is usually better because more visits are showing useful behaviour.
Page views
Total pages viewed. If page views grow faster than sessions, visitors are usually exploring more deeply.
Average engagement time
The amount of time visitors actively engaged with the site. It helps show whether people are reading and interacting.
Event count
Total tracked actions, including page views, engagement, session starts, scrolls, clicks, forms, and lead-intent actions.
Key events
Important actions marked in GA4 as business outcomes. For Coral, these should include calls, confirmed leads, quote requests, and emergency-service actions.
Session key event rate
The share of sessions that produced a key event. If traffic grows but this rate falls, conversion pathways may need improvement.
Organic Search
Visitors who arrived from unpaid search results, such as Google search results.
Direct
Visitors where GA4 does not see a referring source. This can include typed URLs, bookmarks, GBP/app traffic, or untagged links.
Referral
Visitors who came from another website that linked to Coral. Sudden spikes should be reviewed for quality.
Organic Social
Visitors from unpaid social media links, such as Facebook posts.
Form start / form submit
Visitors beginning or completing a website form. These are important because they are close to real leads.
rebate_click / financing_click
Visitors clicked rebate or financing-related links. These show buying research and support higher-ticket HVAC decisions.